
Do you know what attracts campers to stay at your campground or RV park? Do the amenities attract more guests? What about site types? Concrete pad or dirt? Full hook up or partial hookups? 30 or 50 amp? All these questions are fundamental to running your business to the best of your ability and ensuring you invest in the right areas that continue to grow your park and profitability. With a campground virtual tour gathering this data is now easier than ever. CampSite 360 has compiled data from our virtual tours to see what matters most to campers!
The data collected comes from one client and covers the previous 90 days before the start of their peak season. The data covers over 60,000 photo views from more than 3,000 tour users.
Key Findings
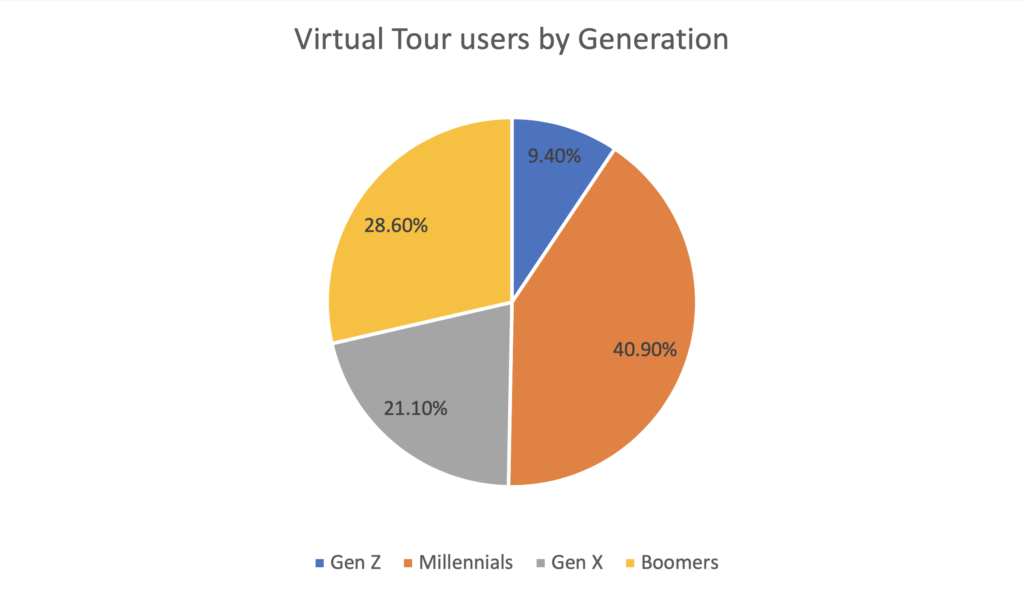
Virtual tour users by generation
Millennials are the largest single user group for virtual tours. This may be no surprise, but Millennials are the most frequent users of campground virtual tours. With KOA reporting that 54% of new campers are millennials, we see 40.9% of users in the same age demographic. One of the more surprising findings is that the Boomer generation makes up 28.6% of campground virtual tour users. This contrasts with the stereotype; that older generations don’t use technology as frequently as younger generations. This data shows they are just as interested in viewing campsites as every other generation.
- 3,234 first-time users used the virtual tour. Of these users, 400 people returned for multiple sessions.
- User demographics
- 8% of tour users were female
- 2% of tour users were male
- User demographics
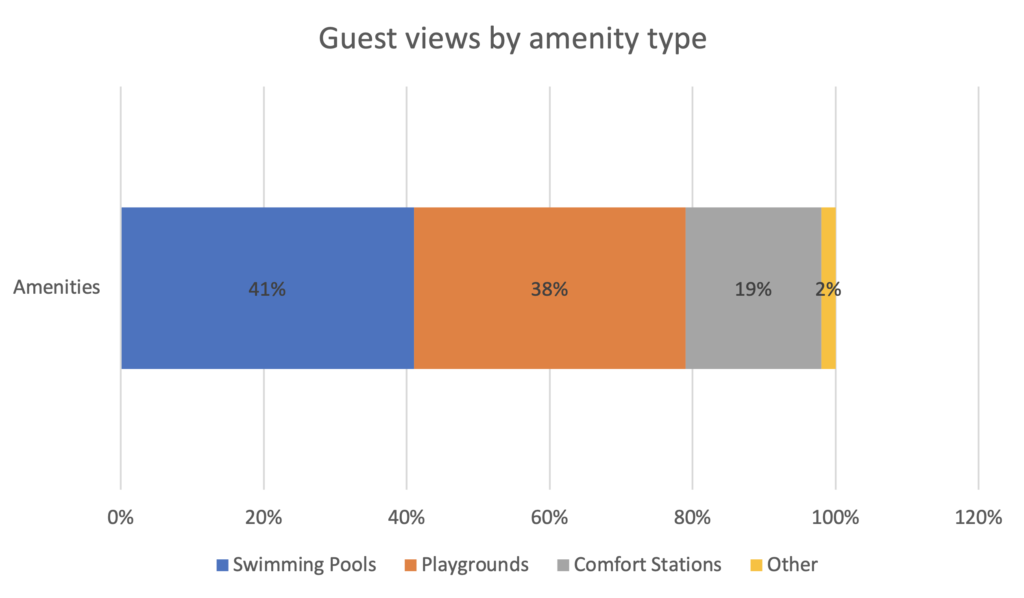
Views by Amenity type
- Amenities matter, but they may not be the ones you’d expect. Amenities within the tour include swimming pools, comfort stations, playgrounds, and sports areas, including mini-golf, basketball, and volleyball courts. Swimming pools accounted for 41% of the amenities viewed, while comfort stations (ex: shower houses) were 38% of views, and playgrounds were at 19%. The lack of significant differences in pools and comfort stations was surprising since most owners would say pools and playgrounds are the major attractors for guests. One key element observed is that the playground and the closest comfort station are the two most frequented areas. The park used in the data collection had a comfort station adjacent to the playground. Over 50% of users who viewed this playground went directly to the comfort station! As confirmed in our conversations, parents looking at playgrounds want to know what the closest restrooms look like.
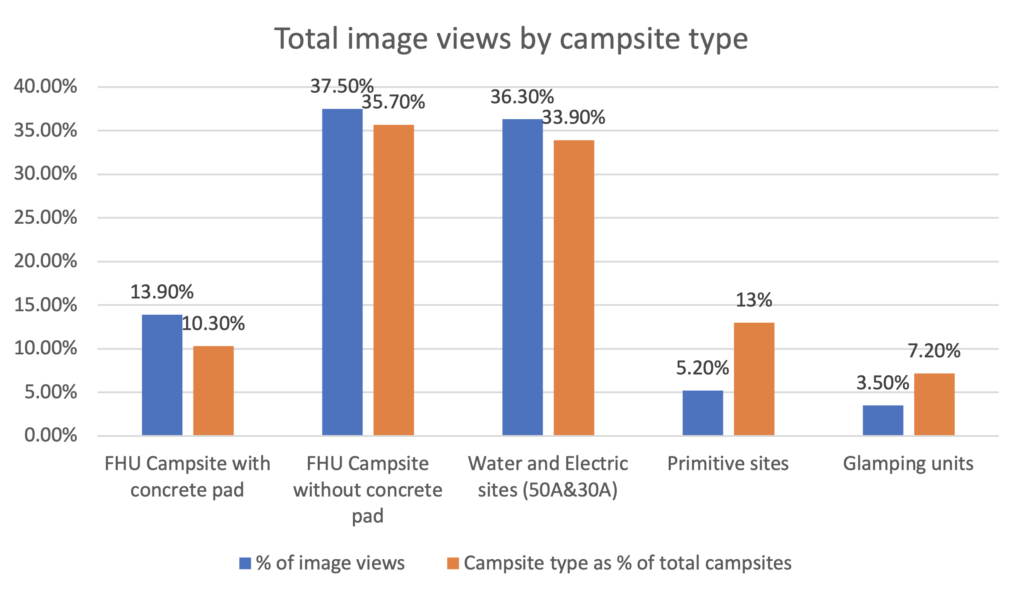
Views by campsite type
- Campsites matter, A LOT! Our findings show that 95.8% of all images viewed within the campground virtual tour are campsites! The variance in views for the most viewed amenity and campsite is negligible, 0.5% difference in views, with the swimming pool having higher views.
- On average, guests view 100 images within the virtual tour and spend 2 minutes and 22 seconds browsing the tour on their first visit. For the 400 users that returned to the tour, an additional 45 seconds is spent looking through campsites. This information tells us that today’s camper is more interested in what a park looks like and the layout of the campsite than pools or playgrounds. Campers have reported high interest in playgrounds and pools, which are considered “check box” amenities. In other words, campers want to know the looks of amenities but weigh the importance of which campsite to choose more favorably.
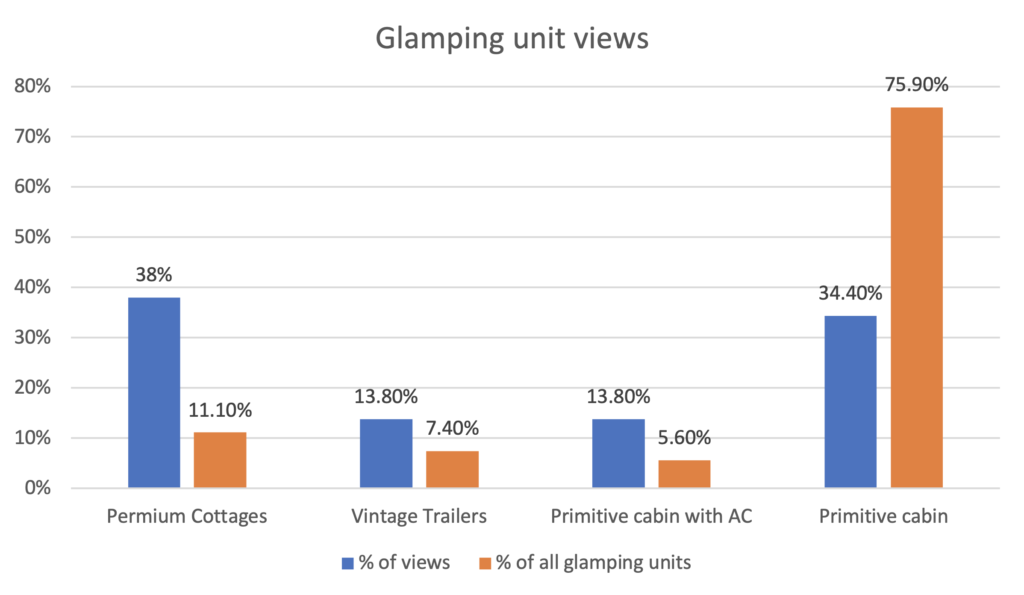
Views by Glamping unit type
- We did see a higher percentage of people frequenting the campground’s premium rental cabins over their other glamping types.
- Glamping Units – In our data, glamping units of all types had fewer users viewing these sites but a higher number of interactions. This shows that guests looking to book a glamping unit were more likely to return to the unit to see the layout and amenities available. Premium cabins offering multiple bedrooms, full kitchens, and bathrooms saw the highest interactions of all units. These types of cabins make up only 11% of all available glamping units but saw the most interaction at 38% across all types of glamping units.
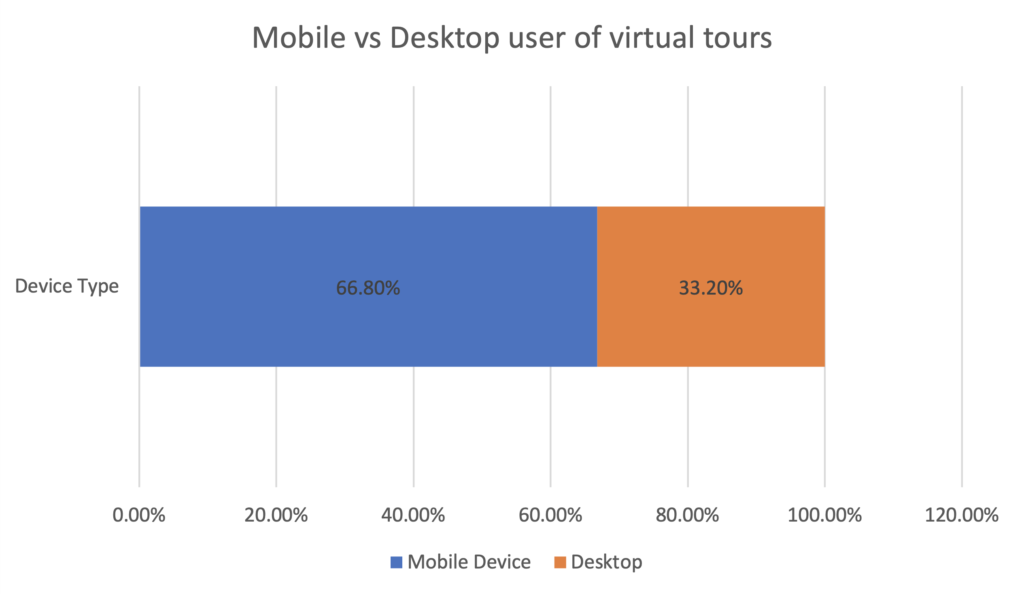
virtual Tour use by device type
Interactive Campground Map Use
Campers prefer to navigate with an interactive campground map. We found that over 681 of 763 campsites, cabins, and amenities were viewed by users directly from the interactive campground map. Sites were viewed a total of 2,119 times by users. The campground map was the starting point for many tour users allowing them to jump to a specific site or section and begin searching for campsites. Once users navigate to a site or area, they continue navigation throughout the park, viewing an average of 106 images per user. This means they interacted with 106 different photos within the virtual tour.
Conclusion
Until now, gathering data surrounding the campers’ desire to view campsites was virtually non-existent. Now we can look deeper into the campers’ decision process and what the items are influencing their decisions. With this new data, we see that viewing the campground in detail matters to today’s campers. Viewing campsites allows the camper to be confident with the campground of their choice and the areas they will be staying in. We can tell this by the number of images, the average user views, and the time they remain engaged on a virtual tour. Additionally, premium glamping options generate more interest from guests considering a glamping vacation. Owners who invest in individual site images and virtual tours will set their parks up for future success as campers come to expect more detailed data on campgrounds. This information will help an owner differentiate within their local market, attract new guests, and boost their occupancy and revenue. It can also help direct investments into the park areas that will help generate the most revenue.o.
About CampSite 360
CampSite 360 specializes in creating 360° virtual tours for the outdoor hospitality industry. Virtual tours help campgrounds, RV resorts, and glamping destinations to attract and retain new customers while also boosting revenue through increased occupancy and demand. Their industry leading software integrates with your existing booking software and Google Street View. Allowing guest to easily navigate and book a campsite from the tour.